
 Tom D. Tamarkin
Updated September 18, 2016
The Physics and Molecular Biology Implications of Widespread Smart Meter Deployments
The electrical utility industry sells power to approximately 125 million small single phase accounts. For over 100 years the industry has billed customers for their power based on the numeric dial readings of electro-mechanical kilowatt hour meters. These meters are typically read once a month by a large number of meter readers walking up and down streets. In the case of Rural Electric Coops, often times customers read their own meters and send in a post card every month or so. The installed base of meters is aged and becoming much less accurate. At the same time labor costs are rising. Thus, utility companies are in the process of replacing these old meters with new modern electronic meters which are accurate, preform more useful functions for the smart grid, and automate the meter reading process by sending the meter readings to the utility companies remotely using radio systems. These are generally referred to as “smart meters.” Some consumer advocacy groups say these smart meter radios create dangerous EMR emissions which can affect people’s health. Costly litigation has occurred in the industry to attempt to curtail smart meter deployment and a “cottage industry” has emerged selling products to “protect” the consumer from the meter’s radio waves. This paper explores the nature of radio waves based on the science and physics of the electromagnetic spectrum and its fundamental photon. It is argued that the smart meter’s radio waves are no more harmful than standard AM radio, television, and all consumer wireless device radio waves; i.e., wireless PC routers, wireless mice & keyboards, wireless cable TV adapters/convertors, wireless Bluetooth earbuds, cellular telephones, wireless home security systems, and new Vehicle 2 Vehicle radio safety systems are but a few examples of the ubiquitous use of radio waves composed of the “photon force carriers.” It is shown that man lives in a safe, low-level, non-ionizing radio wave based society, and indeed is exposed to background cosmic radiation composed of photons with much higher energy levels than radio waves. In conclusion it is shown that smart meter radio waves are no different than other radio waves and that the anti-smart meter community is using this radio wave safety issue as a scare tactic to force legal compensation settlements with utility companies and to justify unneeded “protective” goods and services to be sold to unsuspecting people who do not need them.
Keywords: electromagnetic radiation, EMR spectrum, photon, electron volt, frequency, wavelength, spread spectrum, Kilowatt hour meter, smart meter, mesh network, ionizing radiation, microwave dielectric heating.
A “smart meter” is a modern communicating electrical utility Kilowatt hour meter used for billing purposes by the utility.
There is an installed base of over 60 million “smart meters” now and this will grow to over 110 million by 2020.
These meters work by combining a simple solid state volt meter and ampere meter, a simple electronic calculator with many memory registers, and a time & date clock synchronized to real time.
A modern state-of- the- art smart meter provides many useful functions for both the utility and the consumer.
These meters have an electronic solid state radio transceiver (transmitter & receiver module) operating at the 902-928 MHz, ISM band range, spread spectrum to transmit & receive customer billing data and other parameters to and from the power meter located at a power customer’s site to the utility company’s billing system. This is referred to as the WAN transceiver. Most new smart meters have a second transceiver operating at the 2.4 GHz band using “ZigBee” protocol to allow data from the smart meter to be transmitted inside the home and vice versa. Thus, displays, thermostats, smart appliances, electrical vehicle charging stations, and the like communicate to the meter and on to the utility company. This is referred to as the LAN transceiver. Some utility companies refer to it as the HAN or home area network. Today, roughly 95% of all smart meter LAN/HAN transceivers are not turned on. Most utilities have pilot programs with energy displays, smart appliances & thermostats. It is anticipated that large numbers of the LAN transceivers will be activated over the next couple of years.
The typical WAN transceiver operating power range is in the 25 milliwatts to one watt range spread spectrum so it is “unlicensed” and falls under Part 15 of the FCC code as opposed to Part 18 for true ISM. Most embodiments of system technology today allow for the dynamic adjustment of transceiver transmitter power to the lowest power needed to assure reliable communications with other meters in a mesh configuration and/or a Neighborhood Area Network “pole top” data concentrator.
The 2.4 GHz ZigBee LAN operates at 100 milliwatts.
In most states these meters are located outdoors mounted in metal boxes and separated from in-facility living space by both the metal enclosures and construction materials which collectively absorb a large amount of signal or radio frequency energy.
Radio waves are part of what scientists call the electromagnetic radiation spectrum. Simply put radio waves are emitted when two magnetic fields are moved in close proximity across angular planes. If you take two magnets virtually touching one another, and flip one from North pole to South pole leaving the other stationary you created an electromagnetic pulse. That pulse can be measured on sensitive electronic instruments. The frequency of the pulses is a function of how fast the movement is. Think of low frequency sound from 15 Hz to say 20,000Hz. Or the familiar power line frequency in the U.S. of 60 cycles or Hertz; 50 HZ in much of the remaining world. Then we go up in frequency to very long radio wavelengths like AM; 550 kilohertz (KHz) to 1,600 KHz. We move up the radio wave frequency to short wave, then the old TV bands, FM radio, the cellular system operating around 875 megahertz (MHz) and then the ISM band of 902-928 MHz. ISM means Industrial, Scientific, and Medical.
Virtually all new diagnostic medical instruments in modern medical clinics and hospitals are wireless operating over a wireless network in this range. And unlike the smart meter which is outside the home and separated by a metal box and lots of construction material greatly reducing the radio wave intensity inside the facility, those medical instruments are right next to the patents and hospital personal who work there 40 to 50 hours a week! The dose of ISM band radio waves in such a hospital or medical clinic are at least an order of magnitude higher than one would ever get from a smart meter and virtually continuous as opposed to a data packet burst every 15 minutes. Why? Because of the “inverse square law” which states that the EMR energy level falls off at a rate of 1 over the square of the distance (double the distance and the energy level is ¼; double again and the energy level is 1/16) coupled with the constant data packet bursts in a hospital. The 902-928 MHz ISM frequency band has been licensed for ISM use since the late 1970s by the FCC under Part 18 and studied rigorously.
Now there are some folks in the “anti-smart meter” community who make silly claims knowing the average American has no idea what they mean. As an example they will say smart meters emit “microwaves” and then show a picture of a microwave oven cooking something. Well not so fast, please. A microwave would have a frequency of 1,000 MHz or 1 GHz or higher. The smart meter ISM band is 0.902 GHz. Close but not yet there. A microwave oven works by causing the polar hydrogen hydroxide (H2O or water) molecules in food to vibrate producing microwave induced dielectric heat. This takes high power concentrated inside a shielded metal box. Often times anti-smart meter folks will show an illustration of a smart meter with the radioactive symbol on it suggesting that the smart meter has radioactive materials in it! Nothing could be further from the truth. This is an attempt to confuse scientifically laypeople into thinking the meter emits dangerous “radiation.”
All electromagnetic radiation (hereinafter EMR) is based on “emitted photons.” A photon is an elementary particle or the “quantum” of light and all EMR with no rest mass. It is the “force carrier” of the electromagnetic radiation. Now we get into quantum mechanics but it will be kept simple here.
The effects of this force are observable at the microscopic and at the macroscopic level, because the photon has zero rest mass. This allows long distance interactions. Like all elementary particles, photons are currently best explained by quantum mechanics and exhibit wave–particle duality, exhibiting properties of waves and of particles. For example, a single photon may be refracted by a lens or exhibit wave interference with itself, but also act as a particle giving a definite result when its position is measured. Waves and quanta, being two observable aspects of a single phenomenon, cannot have their true nature described in terms of any mechanical model.
The photon has no rest mass and no electric charge. It is stable and has two possible polarization states. In the momentum representation, which is preferred in quantum field theory, a photon is described by its wave vector, which determines its wavelength, λ, and its direction of propagation. A photon’s wave vector may not be zero and can be represented either as a spatial 3-vector or as a (relativistic) four-vector; in the latter case it belongs to the light cone as illustrated below. Different signs of the four-vector denote different circular polarizations, but in the 3-vector representation one should account for the polarization state separately; it actually is a spin quantum number. In both cases the space of possible wave vectors is three-dimensional.
The photon is the gauge boson for electromagnetism, and the photon does not obey the Pauli Exclusion Principle.
Photons are emitted in many natural processes. During a molecular, atomic, or nuclear transition to a lower energy level, photons of various energy levels will be emitted; from radio waves, to infrared, to light, and up to gamma rays. This is how light is created from the combustion of chemical materials as an example.
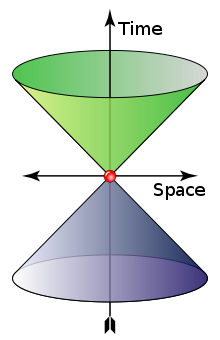 The cone shows possible values of wave 4-vector of a photon.
The “time” axis gives the angular frequency (rad⋅s−1) and the “space” axes represent the angular wavenumber (rad⋅m−1).
Green and indigo represent left and right polarization
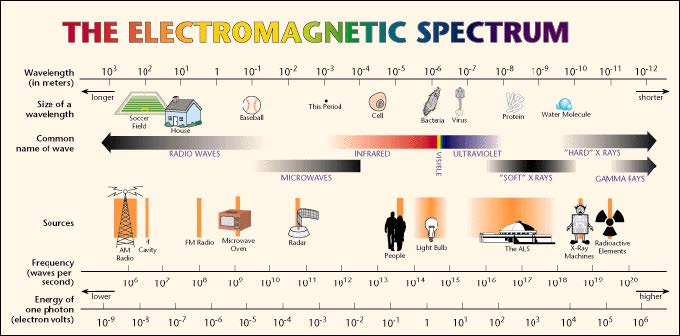
Remember that electromagnetic radiation starts at the slow rate of holding magnets in your hand and flipping one say twice a second or 2 cycles per second or 2 Hertz. It moves up through the audio range, AM radio, short wave, TV, micro waves, infrared (heat), visible light, ultraviolet radiation (think sun burns), x-rays, and on to nuclear gamma rays and finally cosmic rays coming from the creation of the universe itself ≈13.8 billion years ago. The faster the fields reverse themselves (think magnets North and South poles flipping 180 degrees) the more energy the photons have.
The above graphic depicts the relationship of wavelength and frequency in comparison to familiar objects. The precise relationship between frequency and wavelength is
f = V/λ
Where,
f is the frequency
V is the wave velocity or speed (assume C or ≈2.99 X 10⁸ m/s which is the approximate speed of light in a vacuum)
λ is the wavelength of the wave
We do not worry too much about any molecular biological effect radio waves and EMR have until we get to far infrared (heat) and then on to ultra-violate light. The visible light spectrum of red, orange, yellow, green, blue, indigo, and violate is squeezed in-between infrared and ultraviolet. Yes! Heat and light are forms of higher frequency (shorter wave length) higher energy level EMR. Now as said before, emitted EMR consists of the amazing photons, the elementary particle with no rest mass that confounds many people because it has both particle and wave characteristics as described above.
All of this may sound very scientific to many people today, although in the 1960s this was freshman high school physical science curriculum.
We refer to EMR (radiation) which does damage to animal and plant tissue as “ionizing radiation.” This means a level of radiation that causes a chemical change in tissue and/or stimulates nerves to suggest a “sensation” in a well-developed animal species. As stated above the photons comprising EMR are force carriers. The greater the force, the more likely they cause ionizing effects and chemical changes, because chemistry involves moving electrons around and that takes energy. A simple example is the hotter a stove burner, the more damage it does to your finger when you touch it. However if you just “tap” the burner for a fraction of a second with your finger to see if the stove burner is on, no tissue “damage” occurs. There are two things at work here. One is the frequency or wave length of the EMR and the second is the power level; i.e., how many photons are received per square unit of surface area. The second can be a function of instantaneous power or received power integrated over time. An example is the finger “tapping” the stove burner. Do it once and you get the feel of the burner being on. No problem. But do it 20 times over a one minute period and you now have a serious burn. The same holds true with exposure to all high energy EMR. A radiologist can take one x-ray of your arm. No problem. He can take 10 x-rays of your arm over a couple of months. No problem. But if he takes 1,000 x-rays of your arm over a week, you will most likely suffer radiation burns and develop a cancer.
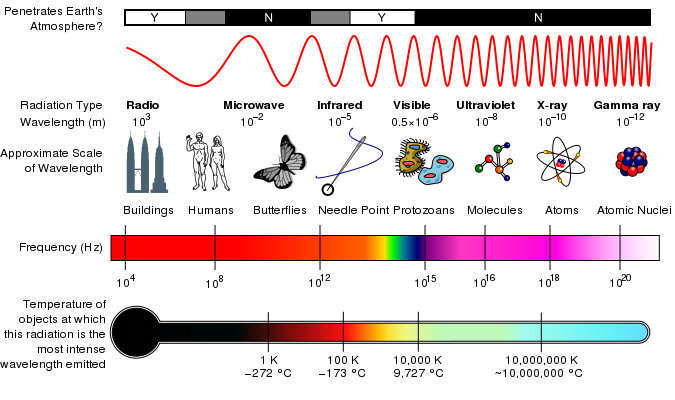
The above graphic shows the energy level of photons as a function of frequency/wavelength
As can be seen above, the ISM band is in the 109 range for frequency (meaning 1 GHz) but its photon energy level is 5 X 10⁻⁶ electron volts. That is an extremely small amount of energy; i.e. .0000005 electron volts.
An electron volt, symbol eV, is a unit of energy equal to approximately 160 zeptojoules or 1.6×10⁻¹⁹ joules. A joule is a unit of energy. A simple explanation for the amount of energy comprised by one joule is 1 watt per second. So one electron volt equals .0000000000000000016 watt seconds.
But when you move up to infrared at 1012 range of frequency, the energy is 10-1 electron volt range. That is 105 times or 100,000 times more energy!
That is why you do not want to touch the antenna of a TV station transmitting 100,000 watts at the old analog channel 2 (KCBS in Los Angeles as an example.) You would get a very bad RF burn. But move ten feet away from the antenna and not much happens; a block away and zero effect.
Today we live in a wireless world. At the recent 2016 Consumer Electronics Show (CES) show in Las Vegas most all new consumer products are wireless based. Now the U.S. Department of Transportation is mandating new cars in 2018 to have V to V radio communications (a form of vehicle to vehicle radar) to avoid collisions.
The V2V communications system proposed to be mandated by all automakers selling vehicles in the U.S. operates in the 5.9 GHz range using the DSRC or Dedicated Short Range Communications standards which allow very high data transmissions critical in vehicle safety applications. This frequency range is 5 times higher than the 902-928 MHZ, ISM range used by the smart meter and is squarely in the “microwave” frequency spectrum. Yet it is photon energy level is only 3 X10⁻⁵ eV; marginally higher than that of photons in the 902-928 MHz range.
Everything from wireless home PC routers and switches, to cable TV wireless convertors (think AT&T commercials…move your TV anywhere in your house with no wires….), to wireless mice and keyboards, to blue tooth cell phone ear buds, operate in either the 902-928 MHz frequency range or an even higher range of 2.4 GHz. There is no getting away from EMR. There is a huge amount of EMR in space coming from the origin of the Sun and all stars. Happily most of the high energy “cosmic rays” are trapped in the upper atmosphere by the Earth’s magnetic field. EMR is natural coming from the “big bang” and the way atomic theory works. And by the way, The Earth’s magnetic field is created by electro-magnetic forces deep within the inner core and outer core of the Earth which act like a massive electro-magnetic generator based on the solid ferromagnetic inner core surrounded by the molten ferromagnetic outer core traveling at different angular velocities.
We live in a world of 100% duty cycle (constant 24 hours a day 365 days a year) exposure to this background electromagnetic radiation. That is part of life!
So why are people suggesting the smart meter behaves differently than all other radio based devices? Even smart people like television actor Chuck Norris have written articles about the smart meter and what their friends have convinced them is “radio frequency pollution” in World News Daily (WND.) And yet Mr. Norris is part of the wireless broadcast industry as an actor.
The reason the smart meter has been attacked relates to the fact that it is an easy target with a rich owner. Average people do not understand this basic science. The meters are owned by utility companies who have lots of money making them attractive legal targets. Furthermore, they are regulated by agencies such as the California Public Utility Commission and similar commissions in every state for the public good. These commissions allow lawyers to file lawsuits against the utilities, on a “public service hardship basis” and then the commissions will reimburse the lawyers for their legal work. Often times a utility will settle a case by giving plaintiffs a cash reward rather than litigate, paying expert witness fees, and risk a jury trial with jury members who do not understand the science but consistently side with the “poor victim” underdogs.
Smart Grid Today, a leading utility smart grid news magazine, published an article entitled “Utility expert describes harm from anti-AMI lawsuits” on July 24, 2013 wherein this author was interviewed on this subject.
An out take from the above article follows: “I have been contacted many times by plaintiff’s attorneys representing class action lawsuits against utilities, meter makers, and commissions because of my work in this field. I always make it a point to explain the facts as outlined above. And then those attorneys never call me again! Why? Because the laws of physics and rules of molecular biology do not support the lawyer’s attempts to “extort” money from the defendants.”
To further add to people’s misunderstandings, there is a whole cottage industry of companies claiming to sell products to “protect” people from the smart meters. This is modern day “snake oil” salesmanship at its worst. There is nothing to be protected from except fear generated by these companies and the anti-smart meter community.
Virtually all smart meter deployments in the U.S. today use the ISM band of 902-928 MHz. A specific form of digital modulation is implemented using “spread spectrum.” This means that the data packet of information sent out is parsed or broken up to use many different discreet frequencies in the allocated band. The reason spread spectrum is used relates to the fact that there are many meters with transmitters and receivers within the receiving range of a specific receiver. Spreading out the “bandwidth” of the transmission significantly reduces the likelihood of packet collisions or interference from one transmitter to another. Furthermore it allows for an order of magnitude increase of power…up to one watt…under the unlicensed provisions of the FCC Part 15 rules.
The power transmitted by a specific meter or “pole top concentrator” is set by a “handshake” with its corresponding receiver to be the absolute lowest power needed for reliable communications. This is established dynamically in real time. Thus the power rating of a smart meter transmitter may be nominally ≤1 watt. In the vast majority of the data transmission sessions it is operating at considerably less power; i.e. ≈30 to 50 milliwatts.
Each meter has a transceiver meaning a transmitter and a receiver. The reason the receiver is included is to allow “handshaking” of data packets and to set transmission power as described above. Moreover, this allows the utility to send control signals and data to each home such as current price information which in turn may be relayed to the consumer by means of a second radio transceiver in the meter as earlier described as the LAN operating with ZigBee hardware and protocols.
Non in-home control signals sent by he utility include remote service connection and disconnection as well as the reset of certain memory registers located in the smart meter used in the calculation of peak demand rates.
The typical system topology today uses a mesh configuration which means that each smart meter on a street can be thought of like a link in a chain. Data from one home is sent/received and relayed on by the meter at another home closest to it.
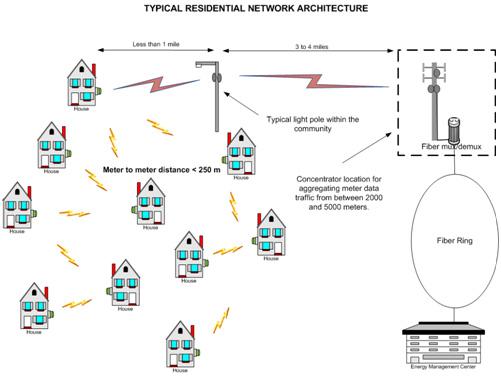
The above graphic illustrates a smart meter mesh network with a “pole top” data concentrator communicating with a longer range radio to fiber optic satellite unit.
Many of the so called smart meter protection products consist of metal screen or can enclosures which, in theory, attenuate or reduce the signal level or EMR energy level of the radio waves emitted by the smart meter. However they also reduce the signal level of the transmissions being sent to that smart meter’s receiver from others in the chain. This causes other meters to transmit at a significantly higher power than they would otherwise transmit at in order to secure communications with the meter covered by the metal shield. This is an unattended consequence which causes other meters located at other homes or business to transmit at virtually full power.
In the above instance the home with the “protective shield” reduces local exposure from its transmitter but increases exposure from other meter transmitters both at this home and others.
Pat Boone addressed the very real and serious smart meter negative matter in his article: “Saving Energy…and our Privacy.” The real issue is one of sending too much un-needed data from each and every smart meter and the possibility for, 1) invasion of home owner’s liberty and privacy, and, 2) the ability by a utility or government agency to control a home owner’s use of power as electricity supplies tighten as a function of the governments “war” on fossil fuel production of electricity. Today the smart meters typically wake up every 15 minutes and send a burst of data to the utility over the wide area radio network. That is 96 bursts per day or 2,880 bursts per month. That is based on 15 minute time of use metering “bin” data transmissions. The preferred approach is to send only one or two bursts of data per month to the utility for billing purposes and emergency reports like a service outage instance or other problem.
Unfortunately the anti-smart meter advocacy group has spent too much time taking the easy way out by focusing on inaccurate and incorrect medical issues resulting from the smart meter and overlooking the much more dangerous civil liberty issues.
Now having said all of the above, there have been limited reports in the literature of people who claim to be hypersensitive to radio waves in certain frequency ranges. Arguably it is possible that these people are under the effect of a “reverse placebo” believing that the smart meter is having a medical effect on them because of suggestion and innuendo. This should be investigated further but clinically with proper measurement and instrumentation of all parameters including a spectral analysis of the EMR in a person’s living area and the integration over time.
A detailed analysis of the old-fashion electromechanical Watthour power meter as well as the new solid state electronic smart meters is presented by Tom Tamarkin in the “Smart Meter School” series of videos (find and click on Smart Meter School.)
To learn more about the smart meter functionality and how it can help consumers and utility companies alike see “What Makes a Smart Meter Smart?” by Tom D. Tamarkin
Characterization of radiofrequency field emissions from smart meters
Richard A Tell, Robert Kavet and Gabor Mezei
This study presents measurement data that describe radiofrequency emission levels and patterns from smart meters (rated nominally at 1 W) currently deployed in Pacific Gas and Electric Company’s service territory in northern California. The smart meters in our investigation could not be set to operate continuously and required a Field Service Unit to induce short periods of emitted fields. To obtain peak field data under both laboratory and ambient conditions, a spectrum analyzer scanned across the 83 transmitting channels between 902 and 928 MHz used by the smart meter on a random frequency-hopping basis. To obtain data describing temporal emission patterns, the analyzer operated in scope mode. Duty cycle was estimated using transmit data acquired by the system operator from over 88,000 m. Instantaneous peak fields at 0.3 m in front of the meters were no more than 15% of the US Federal Communications Commission (FCC) exposure limit for the general public, and 99.9% of the meters operated with a duty cycle of 1.12% or less during the sampling period. In a sample of measurements in six single-detached residences equipped with individual smart meters, no interior measurement of peak field exceeded 1% of the FCC’s general public exposure limit.
Download article at: http://www.nature.com/jes/journal/v23/n5/full/jes2012102a.html